
When the Father of Statistics Ronald Fisher started to witness mounting evidence in favor of the association between smoking and lung cancer, he was quick to fall back into the maxim he helped coin “Correlation does not imply causation”, discounting the evidence as spurious and continuing his habit as a heavy smoker of cigarettes. While his command of mathematics was well above his contemporaries at the time, this speaks volumes for the fact that everybody is prone to bias, and that we should attempt not to fall in love with our hypotheses too early in our decision making process. While Fisher may have had a point, the fact that he was a smoker himself certainly clouded his thinking and led him to not consider fairly all possible explanations for the available evidence.

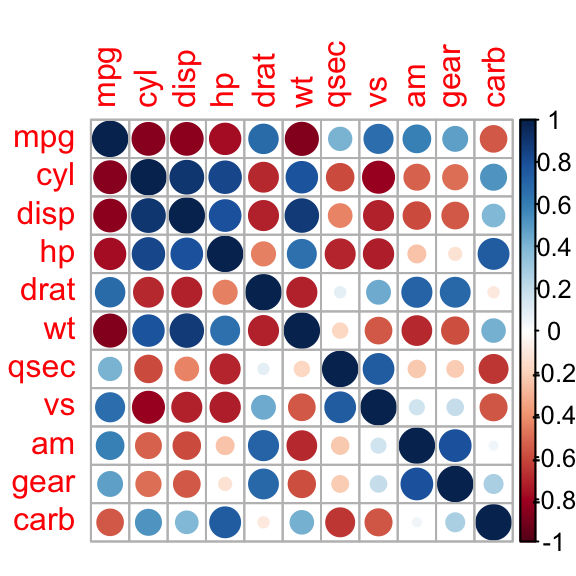
Correlation is very often used within the initial exploratory stage when given a dataset, because of its ability to comb through pairs of variables and swiftly summarize whether they appear to be related or not. Although it comes with limitations, as only linear relationships can be detected in its most common variant, it is a useful tool and a handy one in the statistician’s arsenal. One chart that is appropriate for unearthing related variables is a correlogram, which plots correlations among all possible pairs of variables, in a simple and intuitive way, where colors give clues about the strength and directionality of the examined pair.
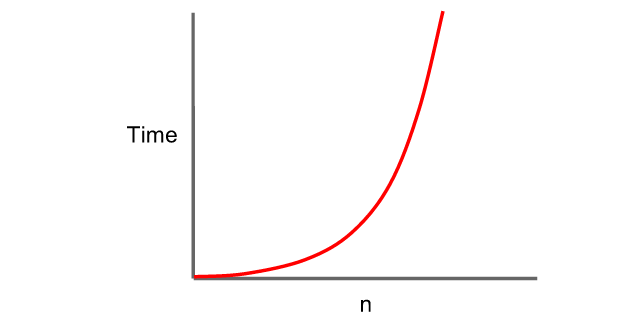
Unfortunately, given that in order to compute correlation considering all pairs of variables, we face running time that is quadratic on the size of the input set, this technique falls apart when considering large data sets, therefore correlation at first implies sluggishness in your typical Big Data project. Although we could resort to sampling, this might introduce hard to spot biases because correlation need not be constant across the whole series, as it frequently occurs with financial data. Thus, sampling the data series should be avoided in our Big Data processing pipeline, to the extent possible.
In order to scale to large datasets, we need another approach, as exact calculation of the coefficients can quickly spiral out of control, and from a pragmatic perspective we prefer fast results, even though they may be slightly incorrect, providing an approximation to the actual values. In 2011, Google published an algorithm for correlation calculations [1] that used to power the now defunct Google Flu Trends project, alongside other initiatives to forecast retail and real estate sales, by using patterns of search activity. Nowadays the service is publicly available through the website Google Correlate.
The approach presented can query millions of variables in a fraction of a second. Scaling correlation calculations holds promise for Biology as well, where we might be interested in analyzing genetic data to find related genes, and Finance, where we may want to find assets with a decent expected return that happen to be the least correlated to our existing portfolio. In both domains a real world example can deal with thousands of variables, and exact computation is not feasible because the computational burden is simply too heavy to bear.
Warning: Geeky content ahead. Proceed at your own risk
Each query may be described as a time series in a high-dimensional space, and we want to know the correlations with other time series that have been pre-processed and stored in the system. For the case of financial assets, we may choose the daily returns over several years for a particular stock. Traditional nearest neighbor algorithms like k-d trees fail to work properly as we increase the number of dimensions, and performance degrades due to the curse of dimensionality. The approach taken by Google consists of performing a projection to a lower dimensional space, and then reducing the dimensionality further through the usage of vector quantization by means of a k-means clustering algorithm. K-means usually is applied over Euclidean distances but correlation can be reduced to cosine distance by first normalizing the time series so that it is centered around zero and with a standard deviation of one.
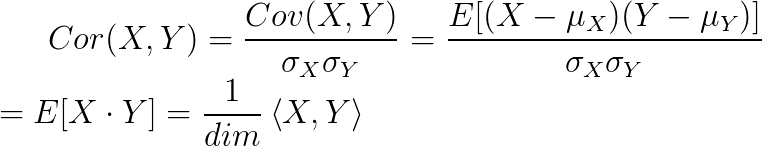
And the cosine distance itself is equivalent to the Euclidean distance when normalizing vectors to unit length, therefore correlation can be treated as Euclidean distance after the appropriate preprocessing stages are executed over the series. Each projected series is then represented by the cluster to which it corresponds, generating an m-bit signature where m is defined by the base-2 logarithm of the number of clusters employed, per quantized chunk of the series.
Finally, during query time, the time series is not quantized itself but it is compared to the quantized version of the stored time series in what Google engineers call asymmetrical information retrieval, by replacing each signature with the appropriate centroid data and then computing the correlation afterwards. By proceeding in this fashion we can reuse correlation calculations for all series that share the same centroid, which greatly helps speed up the computation of the whole set of pairs. Once the top time series are retrieved, the final result can be further refined by calculating the exact correlations over the original data, removing the quantization distortion from consideration.
There is a Spark implementation at Github for the algorithm that helps run the computation over a cluster of distributed machines and that you can reuse for your own personal projects. We have played around with it and are already considering including it in a financial project of ours. As we are always interested in hearing about case studies and practical business applications, do let us know if you find another usage for it within your own business domain. Have fun!
References
[1] Mohebbi, M., Vanderkam, D., Kodysh, J., Schonberger, R., Choi, H., & Kumar, S. (2011). Google correlate whitepaper. Web document: correlate. googlelabs. com/whitepaper. pdf. Last accessed date: August, 1, 2011.


