
Data analysts are often confronted with a seemingly difficult decision, to choose between a simple model, easy to understand, but lacking in predictive power, or a more complex one, that can attain higher accuracy, but simultaneously leaving a funny feeling in the user, who is left wondering about how it works and perhaps more importantly, how it arrived at its result. As with most things in life, everything comes with a cost. And balancing competing goals requires dealing with trade-offs. This is not an easy choice, as if the analyst cannot explain the reasoning behind the model, neither can she explain it to demanding business users. And therein lies the dilemma. Those experienced in the field of analytics have probably faced this dichotomy once or twice throughout their careers.
In the end… trust is what is at stake. Trust in the ability of the analyst, and trust in the predictions coming from the model itself. Be that as it may, given that users are still human beings, this issue must be confronted head on, as otherwise adoption of the proposed solutions will lag, and as precise as the forecast might be, it probably won’t be put to good use. Therefore, we must find a better way forward than merely compromising the model for the sake of explainability whenever we face this conundrum.
Assume we meet a rather extravagant individual. We can ask him any question we wish and we will get back a 100% correct answer, every single time. With only one subtle limitation. Our very wise person is only capable of answering yes/no questions and won’t utter a word otherwise. Now… What would you prefer? Having access to this mighty creature or to an extraordinary communicator capable of painting life in beautiful colours, molding language with Shakespearean ability, but lacking in substance and accuracy? I, for one, would choose the binary savant. But rather than accept a single answer and run with it, astute observers would try to force him to explain, if only by repeatedly guessing at a possible cause:
– Will it rain tomorrow? Yes.
– Is it because of low pressure? Yes.
– Is the low pressure caused by a hurricane? No.
– Is the low pressure due to a storm entering Spain through the Atlantic? Yes.
And there we go. Rinse and repeat until satisfied with the outcome. Perfect models, even if opaque about their quirky ways, can make themselves understood. We can perform something similar when confronted with black box predictions, and perhaps break our bad habit of compromising accuracy when pressed by a stubborn stakeholder. By carefully tweaking the input data, and repeatedly observing the patterns that appear at the output, we can shed new light on the behavior of the model.
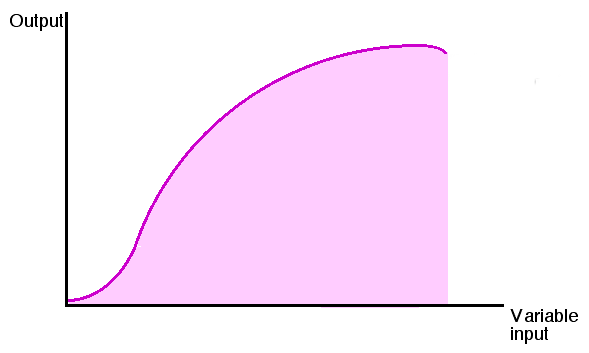
One such method is sensitivity analysis. In essence, this is a simple bidimensional visualization of what happens to the prediction when we vary one of the input variables, while keeping the remaining ones constant. If no matter what we do with the input variable, the output always stays the same, we can safely assume that the variable in question is unhelpful for reaching the prediction. We might as well exclude it from consideration in that situation. Conversely, we might observe that as we increase the magnitude of another variable, the output is also increased, inferring a positive relationship between the two. Do notice that both conclusions were derived pertaining to the specific environment in which the remaining variables were fixed. The relationship could disappear, or even reverse, in other circumstances that we did not analyze, as this is just a local explanation. Sensitivity analysis is undoubtedly helpful, but it misses the target when considering that the output may respond to variability of the inputs either when paired, or in combinations of larger groups. We need a better tool that can account for multiple variables at a time.
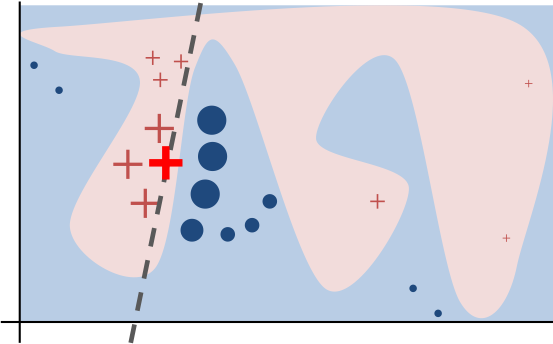
Fast forward to 2016. In a delightful paper by Ribeiro et al, shared in ACM’s conference on Knowledge Discovery and Data Mining, the authors propose a simple approximation to explaining black box models’ elusive predictions. The idea is based on a simple piece of insight. Even if the relationship that the machine model learned might be comprised of a complicated nonlinear function, in the neighbourhood of the actual forecast, it can be approximated by a simple interpretable model, like for example a logistic regression. By introducing small local perturbations to the inputs that resulted in a given forecast, we can create a small dataset to fit a simpler model than the original and derive insights from the weights assigned to each attribute under the linear approximation.
Perhaps the model that most often comes to mind when we think of a black box is a neural network. By wrangling the input through multiplications and activation functions coupled with the use of thousands of different weights across dozens of layers, the fact that the prediction ends up being accurate is nothing short of a miracle. You might have an intuition about gradient descent and backpropagation, but something at the back of your mind nags you for a more adequate explanation. And so do your business oriented users, unfortunately.
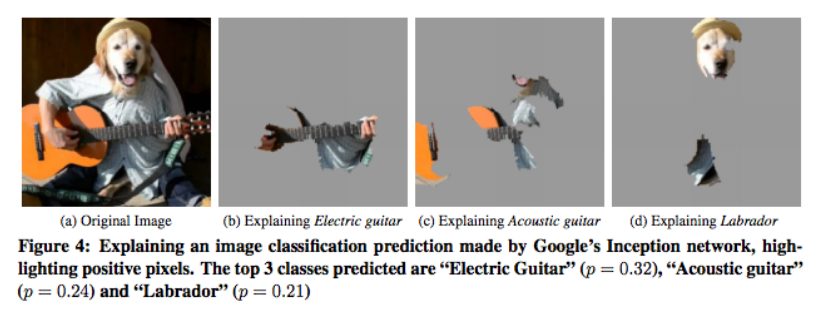
In Ribeiro’s paper the researchers applied the method of local random perturbations to find out the pixels of an input image most important for classifying that same image into one categorization or another, among a thousand possible classes. By quickly glancing at them, humans can effortlessly decide whether to trust or not the forecast coming from the model, because they can see what aspects of the image are heavily influencing the output.
For the programmatically inclined among us, the good news is there are now open source implementations of the algorithm for your amusement and personal enjoyment, both in R and Python, the most popular programming languages used in Data Science. So perhaps the next time that someone decides to challenge your model’s predictions, you can fire state of the art artillery as a first line of defense to back your claims. Best of luck in your future predictive modeling endeavours.


